Advanced Microsoft Excel
Part 20 - Additional Features
Power View in Excel 2013 provides an interactive data exploration, visualization, and presentation experience for all skill levels as you have seen in the previous section. You can pull your data together in Tables, Matrices, Maps, and a variety of Charts in an Interactive View that brings your Data to life. New features have been added to Power View in Excel 2013.
You can also publish Excel workbooks with Power View sheets to Power BI. Power BI saves the Power View sheets in your workbook as a Power BI report.
Power View sheets can connect to different data models in one workbook.
In Excel 2013, a workbook can contain −
- An internal Data Model that you can modify in Excel, in Power Pivot, and even in a Power View sheet in Excel.
- Only one internal Data Model, and you can base a Power View sheet on the Data Model in that workbook or on an external data source.
- Multiple Power View sheets, and each of the sheets can be based on a different data model.
Modify the internal Data Model
You can create Power View sheets and an internal Data Model in an Excel 2013 workbook. If you base your Power View sheet on the internal Data Model, you can make some changes to the Data Model while you are in the Power View sheet itself.Step 1 − Select the worksheet Salesperson.
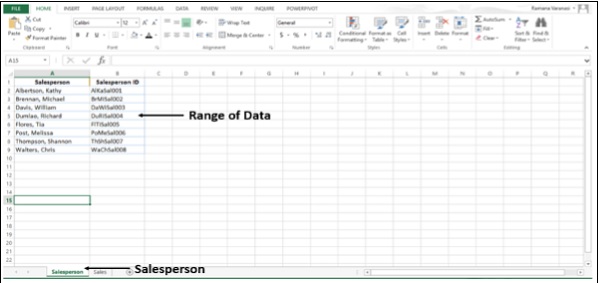 You have a Range of Data of Salesperson and Salesperson ID.
Step 2 − Now select the Worksheet Sales. You have a Range of Data of Sales.
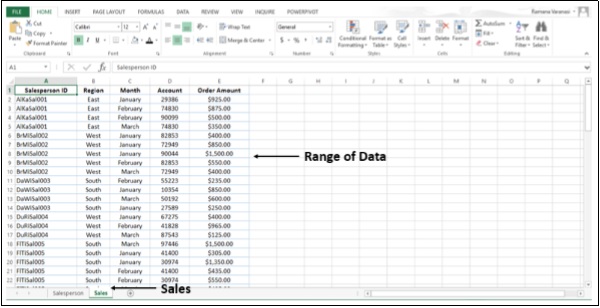 Step 3 − Convert the data in the worksheet Salesperson to table and name it Salesperson.
Step 4 − Convert the data on the Sales Worksheet to table and name it Sales. Now, you have two tables in two Worksheets in the Workbook.
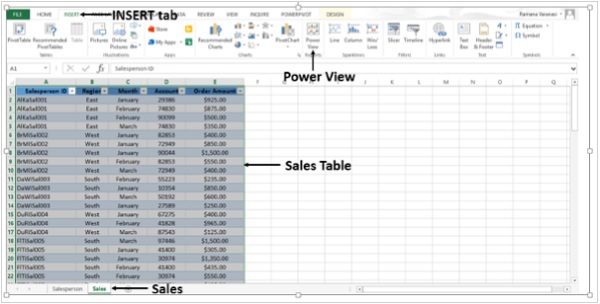
Step 5 − Click on the Sales Worksheet.
Step 6 − Click on the INSERT tab on the ribbon.
Step 7 − Click on Power View.
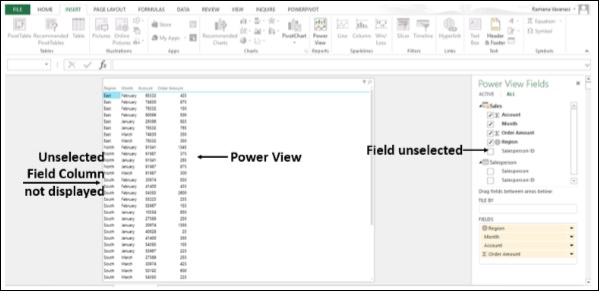
 Power View sheet is created in the Workbook. In the Power View Fields
list, you can find both the tables that are available in the Workbook.
However, in the Power View, only the Active Table (Sales) Fields are
displayed since only the active Data Table Fields are selected in the
Fields List.
Power View sheet is created in the Workbook. In the Power View Fields
list, you can find both the tables that are available in the Workbook.
However, in the Power View, only the Active Table (Sales) Fields are
displayed since only the active Data Table Fields are selected in the
Fields List.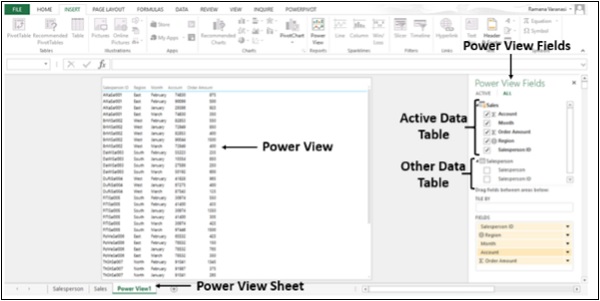 In the Power View, Salesperson ID is displayed. Suppose, instead you want to display the names of the salespersons.
Step 8 − De-select the Field Salesperson ID in Power View Fields.
 Step 9 − Select the Field Salesperson in the Table Salesperson in Power View Fields.
You do not have a Data Model in the Workbook and hence no relationship exists between the two tables. Excel does not display any Data and displays messages directing you what to do.
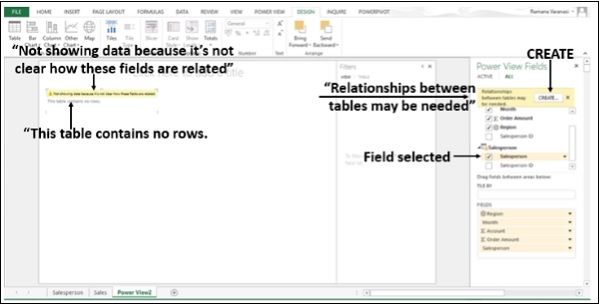 Step 10 − Click on the CREATE button. The Create Relationship Dialog Box opens in the Power View sheet itself.
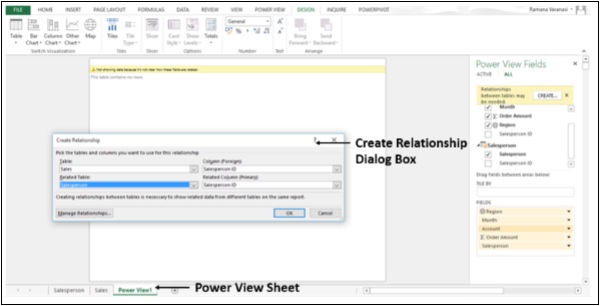 Step 11 − Create the relationship between the two tables using the Salesperson ID Field.
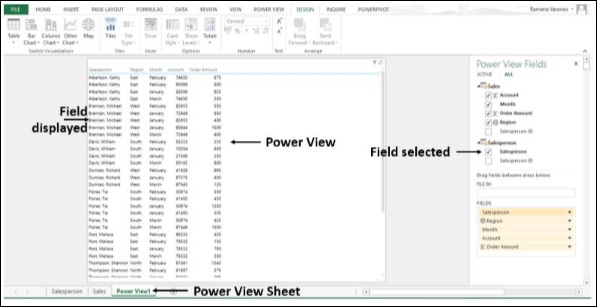 You have successfully created the internal Data Model without leaving the Power View sheet.
No comments:
Post a Comment