Advanced Microsoft Excel
Part 26 - Workbook Analysis
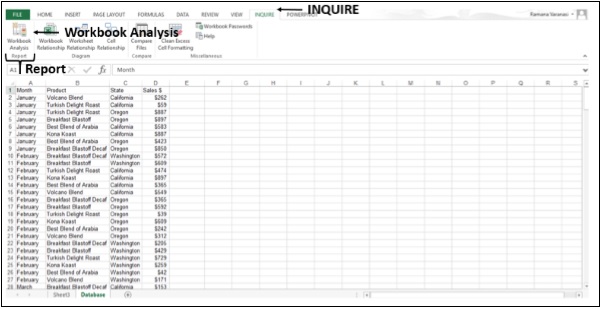
Workbook Analysis command creates an interactive report showing detailed information about the Workbook and its Structure, Formulas, Cells, Ranges, and Warnings.
Step 1 − Click on the Inquire tab on the ribbon.
Step 2 − Click on Workbook Analysis in the Report group.
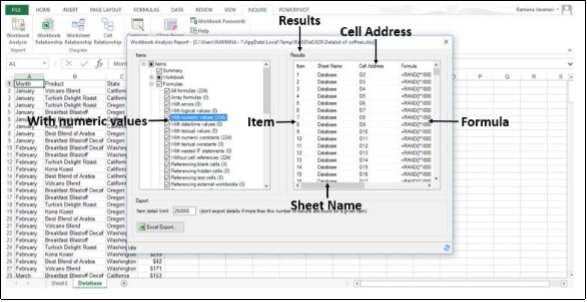
 The Report will be displayed after the Workbook Analysis is completed.
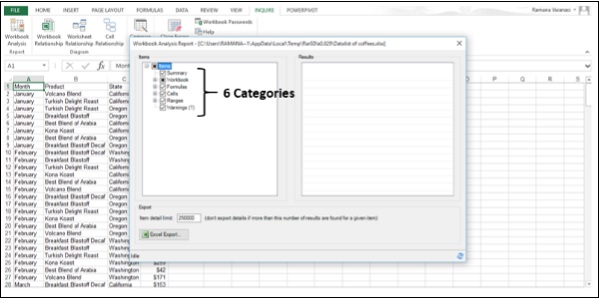
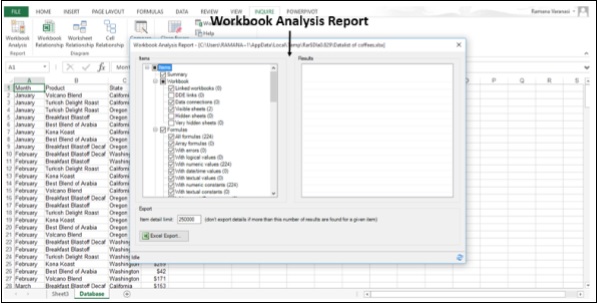 The Report has six categories −
- Summary − General information about the structure and content of the Workbook.
- Workbook (with subcategories) − General Workbook Statistics.
- Formulas (with subcategories) − Specific information about formulas in the Workbook.
- Cells (with subcategories) − Specific information about the cells in the Workbook.
- Ranges (with subcategories) − Specific information about the ranges in the Workbook.
- Warnings − Several types of warnings about the Workbook structure and content.
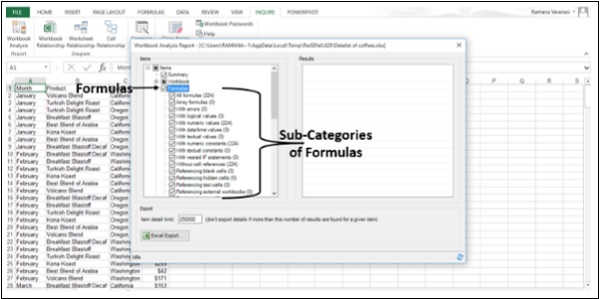
 Selecting a Category gives you more information about that Category.
Step 3 − Click on the Formulas category. Sub-Categories of the formulas will be displayed.
 For example,
- All formulas are 224 in number.
- With numeric values are 224 in number.
 Step 5 − Click on the Excel Export button.
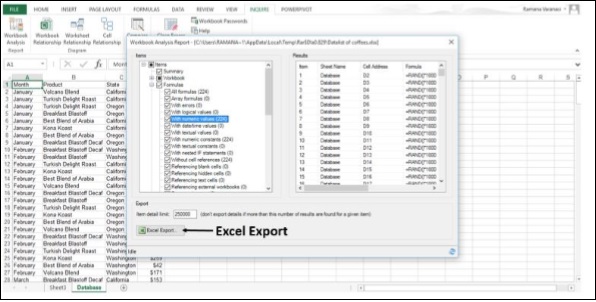 The Save As Dialog Box opens.
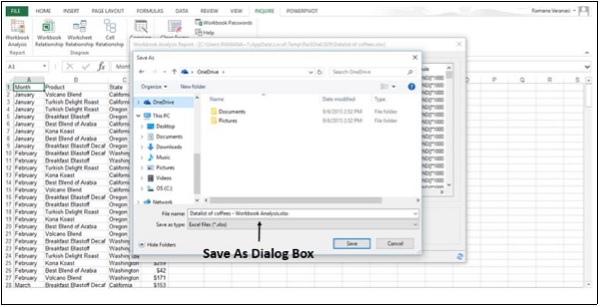 Step 6 − Save the Report as an Excel Workbook. A Load Export File button appears next to Excel Export button.
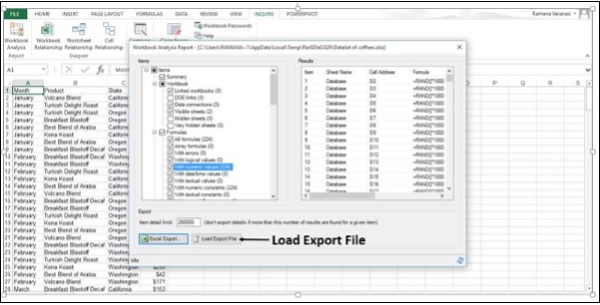 Step 7 − Click on the Load Export File button. The saved Report Excel Workbook opens.
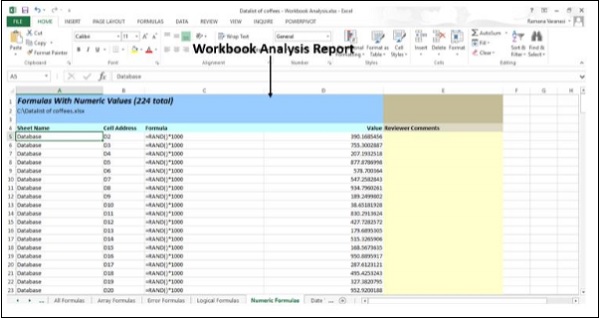
Diagrams
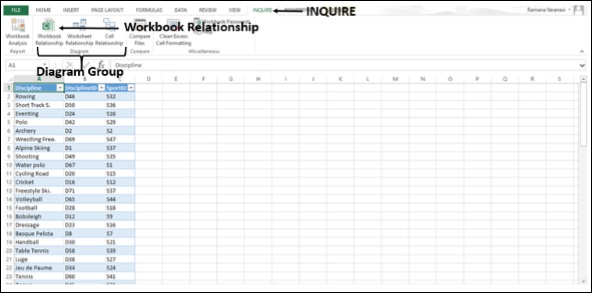
In the Diagram group, under the INQUIRE tab, three types of diagrams are available.- Workbook Relationship
- Worksheet Relationship
- Cell Relationship
Workbook Relationship
You can use the Workbook Relationship diagram to create an interactive, graphical map of Workbook dependencies created by connections (links) between files.The types of links in the diagram can include other Workbooks, Access databases, text files, HTML pages, SQL Server databases, and other data sources.
Step 1 − Click on the INQUIRE tab on the ribbon.
Step 2 − Click on Workbook Relationship in the Diagram group.
 The Workbook Relationship Diagram appears, showing its links with different Data Sources.
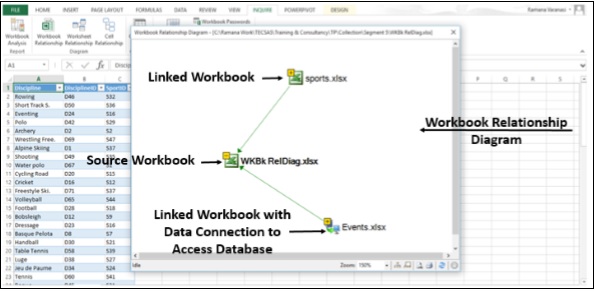
Worksheet Relationship
You can use Worksheet Relationship Diagram to create an interactive, graphical map of connections (links) between Worksheets in the same Workbook and /or Worksheets in other Workbooks.Step 1 − Click on the INQUIRE tab on the ribbon.
Step 2 − Click on Worksheet Relationship in the Diagram Group.
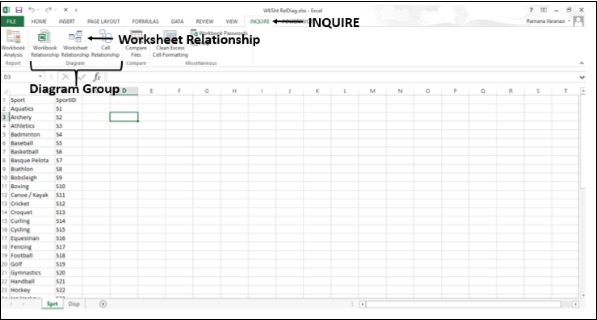 The Worksheet Relationship Diagram appears, showing the links between the Worksheets in the same Workbook and in other Workbooks.
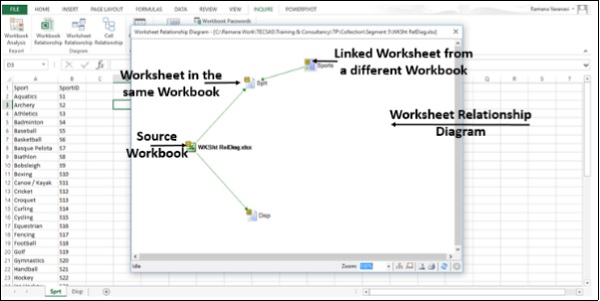
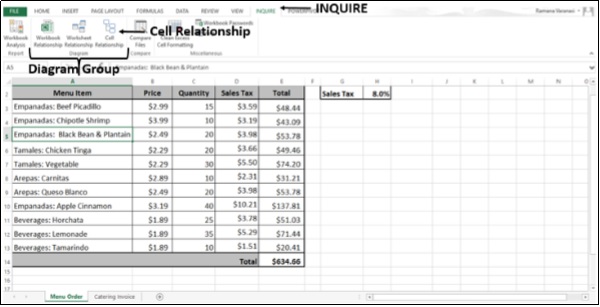
Cell Relationship
You can use the Cell Relationship Diagram to get a detailed, interactive diagram of all links from a selected cell to cells in other worksheets or even other workbooks.Step 1 − Click on the INQUIRE tab on the ribbon.
Step 2 − Click on Cell Relationship in the Diagram group.
 The Cell Relationship Diagram options window appears.
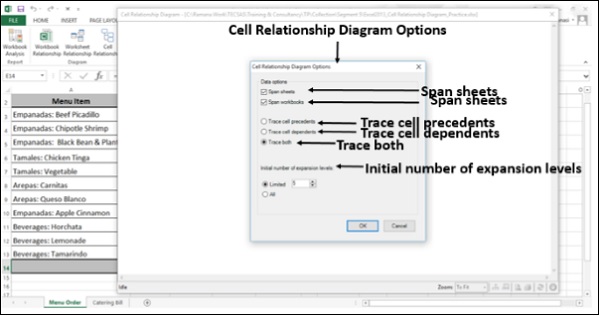 Step 3 − Select the options.
Step 4 − Click OK.
The Cell Relationship Diagram appears, showing links between the Selected Cell and the Cells in the same Worksheet, same Workbook and in other Workbooks, based on the options you have chosen.
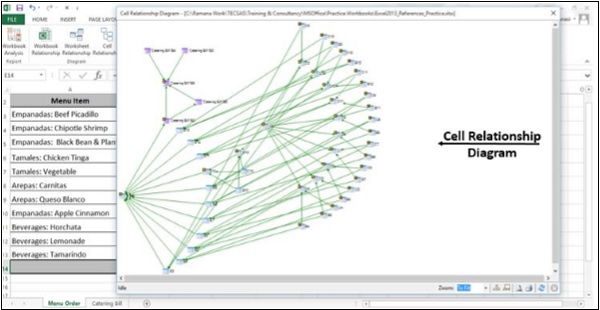 Step 5 − Click on Zoom.
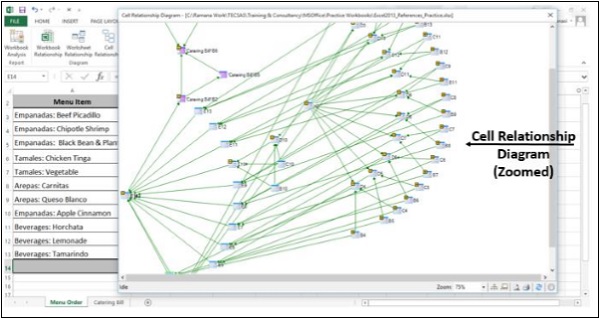 You can view the nodes clearly.
Clean Excess Cell Formatting
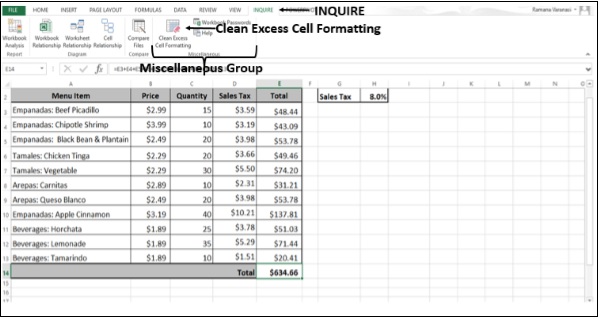
When a Workbook loads slowly, or has become huge, it might have formatting applied to rows or columns you are not aware of.You can use the Clean Excess Cell Formatting command to remove the excess formatting and greatly reduce the file size. This reduces file size and improves your Excel's speed.
But, you may want to make a backup copy of your file before cleaning the excess cell formatting, because there are certain cases where this process may increase your file size, and there is no way to undo the change.
Step 1 − Click on the INQUIRE tab on the ribbon.
Step 2 − Click on Clean Excess Cell Formatting in the Miscellaneous Group.
 The Clean Excess Cell Formatting Dialog Box appears.
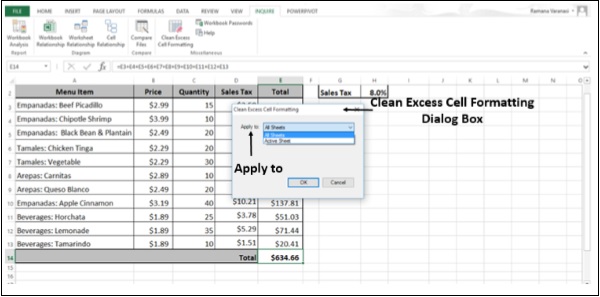 Step 3 − Choose All Sheets in the Apply to box. You will get a message about saving the changes made.
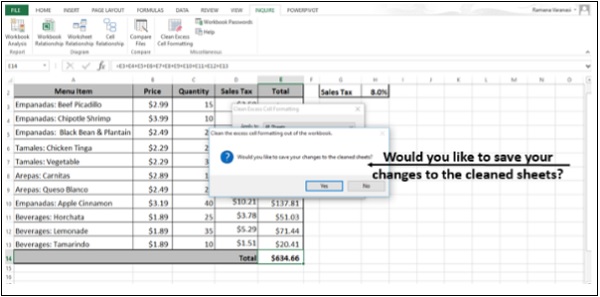 Step 4 − Click OK.
No comments:
Post a Comment